To understand your customers and refine your loyalty program, you should pivot your focus toward the Customer Segments (RFM) and Customer Demographics sections. While revenue tells you what happened, these charts tell you who is making it happen and why they might be staying or leaving.
Focusing on these three areas will give you the most actionable insights for program improvement:
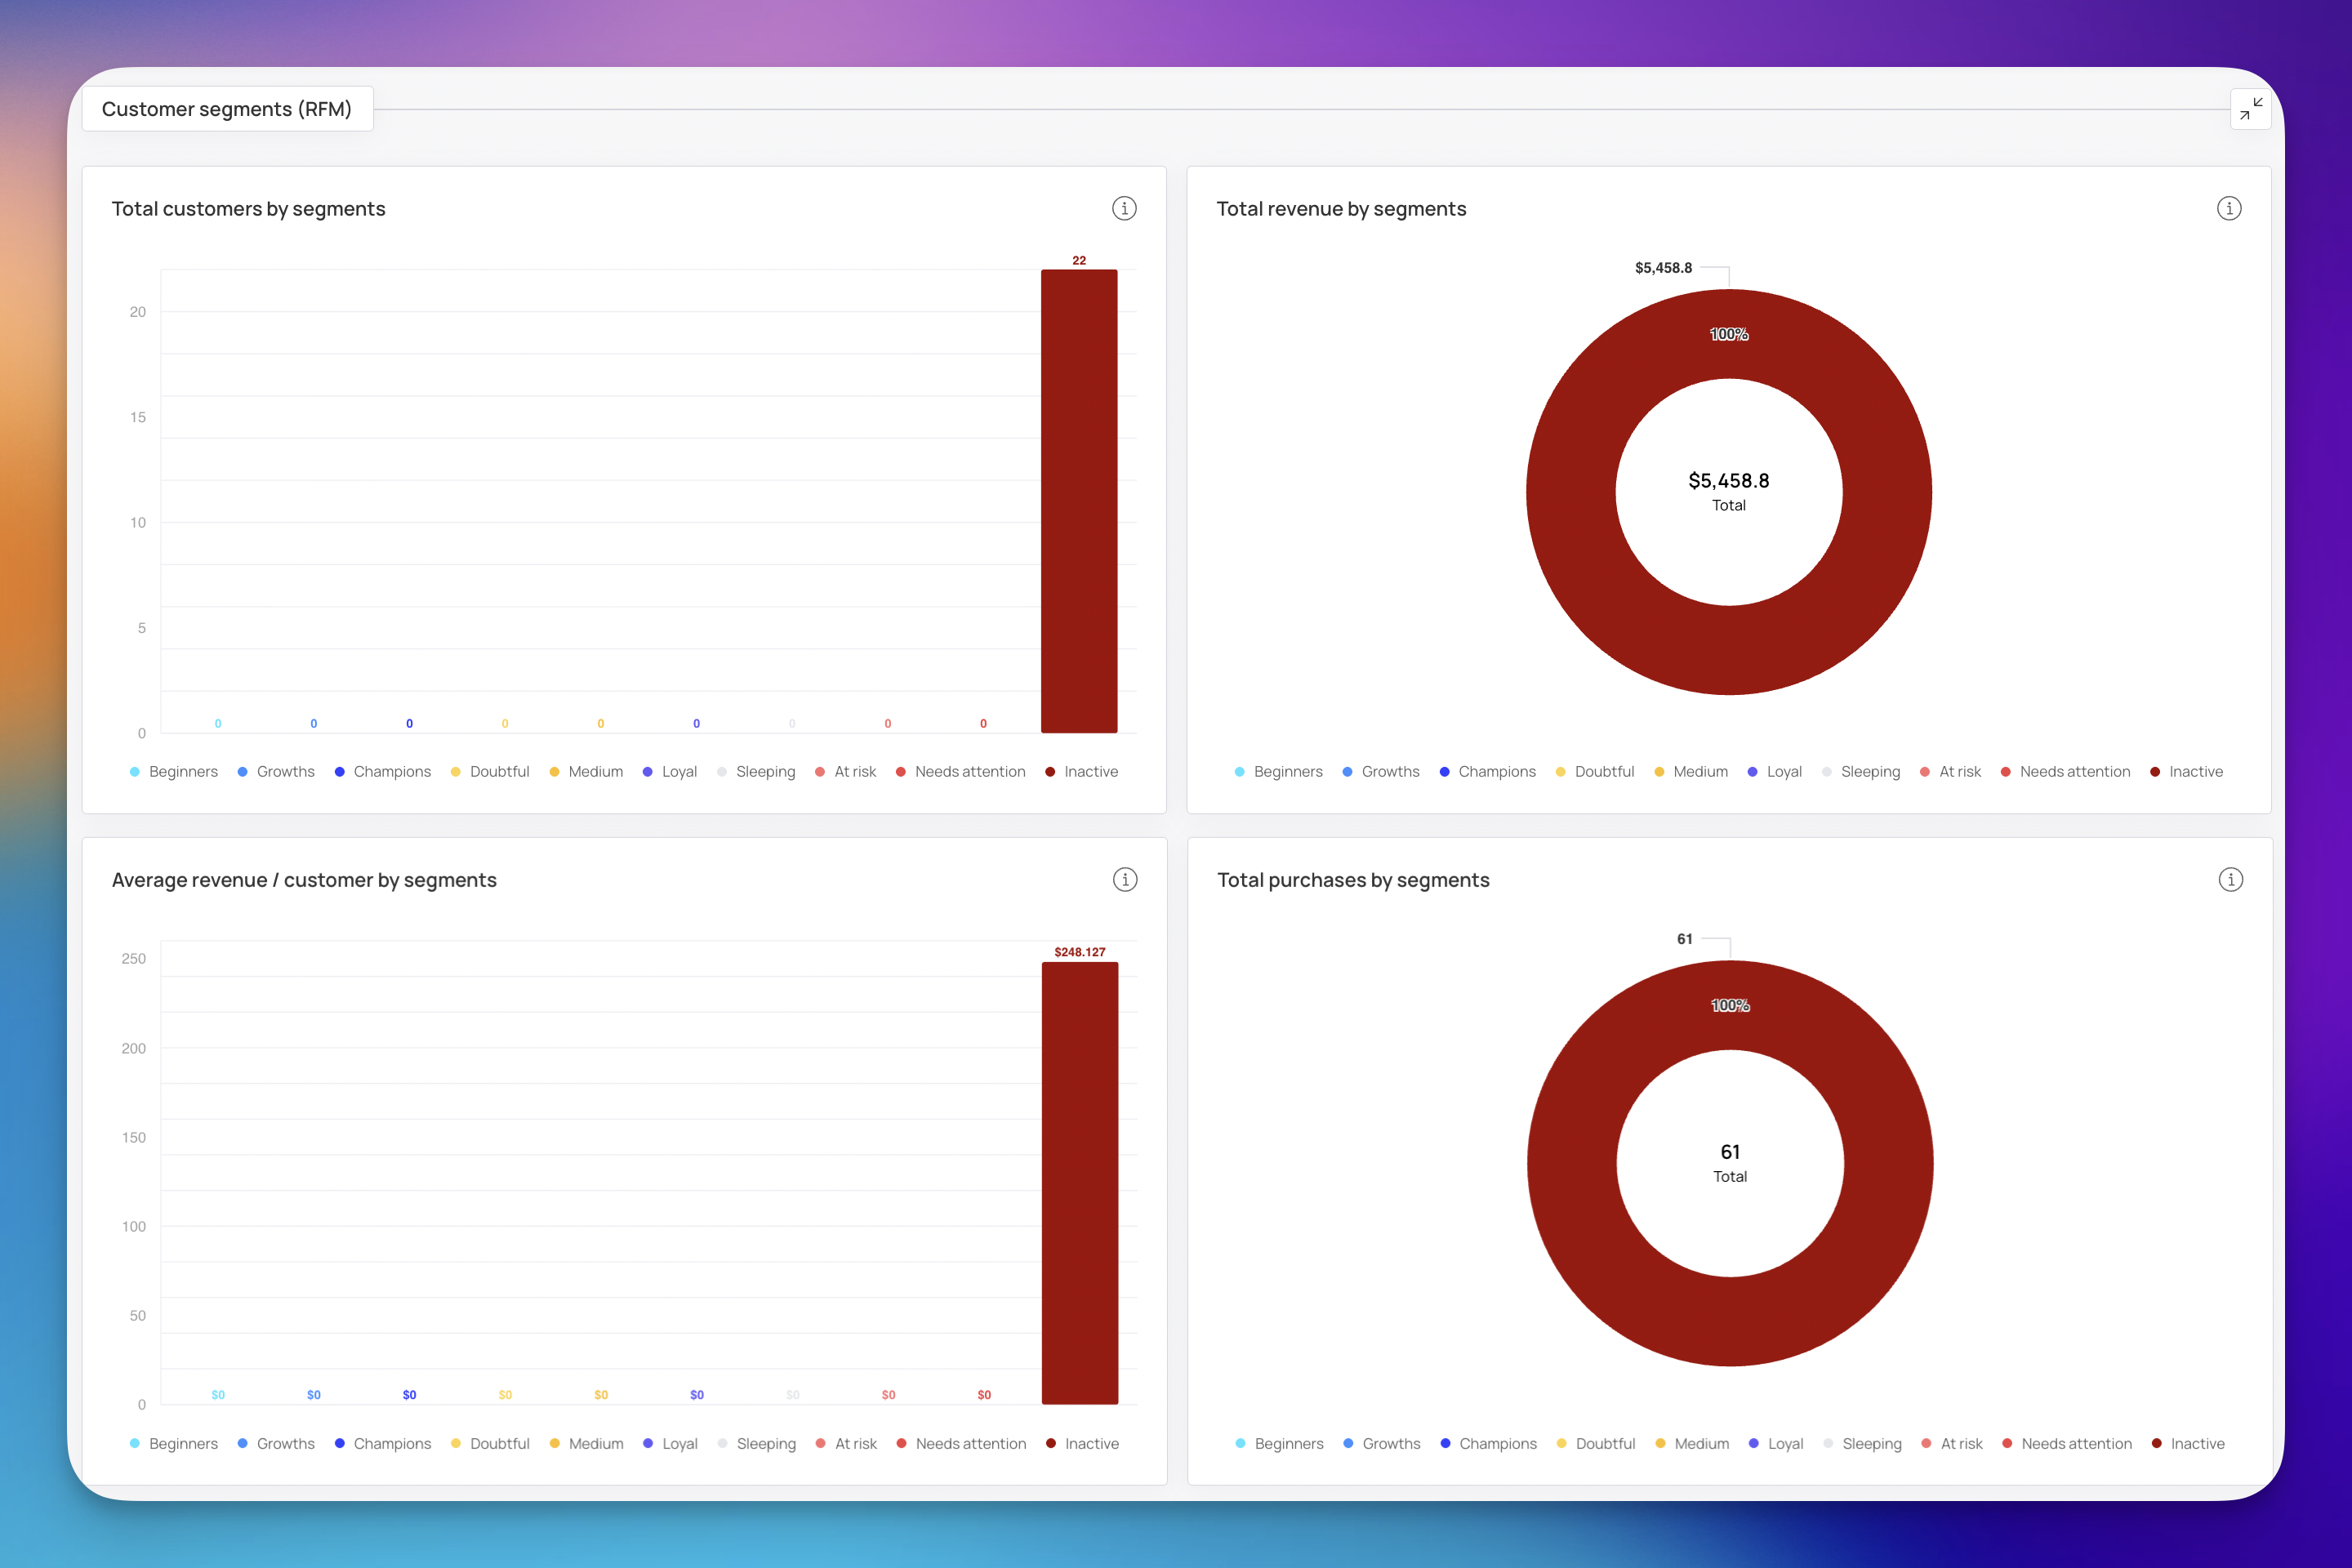
This is the most critical section for program health. RFM (Recency, Frequency, Monetary) analysis categorizes your customers based on their actual habits.
Identifying "At Risk" Members: If you see a growing number of customers in the At Risk or Needs Attention segments, it’s a sign that your loyalty program isn’t giving them enough reason to return. You may need to lower the "points cost" of your rewards or offer more frequent, smaller perks.
Protecting your "Champions": These are your best customers. If this segment is small, your program might be lacking a "VIP" tier or exclusive benefits that make high-spenders feel special.

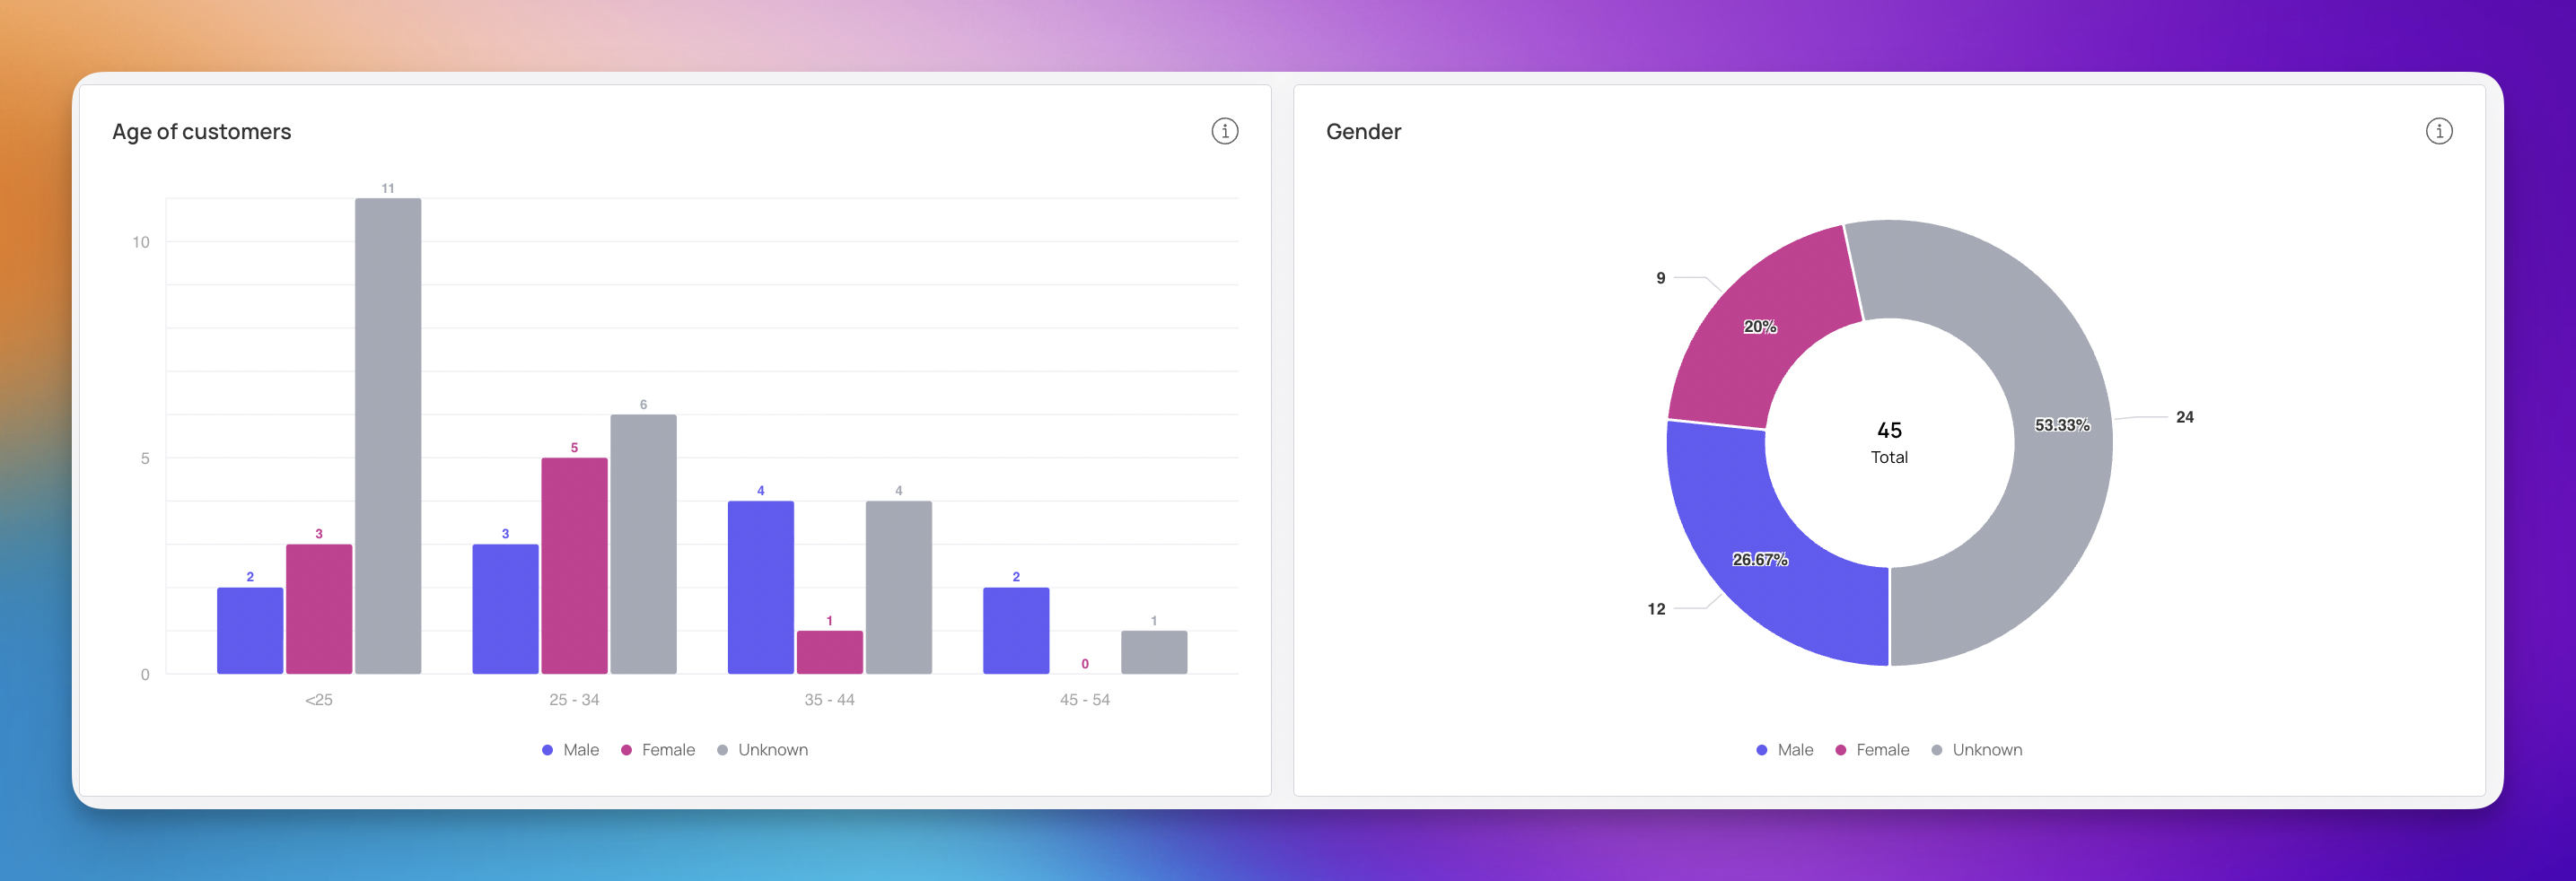
The Age and Gender charts help you align your rewards with the lifestyle of your audience.
Reward Relevance: If your Age of Customers chart shows a majority in the <25 and 25–34 brackets, but your rewards are traditional or "old school," you may have a mismatch. A younger demographic often prefers instant-gratification digital rewards, social media-based challenges, or eco-friendly initiatives.
Closing the "Unknown" Gap: If your demographics show a high percentage of Unknown data, your registration process might be too vague. To improve the program, consider offering a small point bonus for members who complete their profile, allowing you to personalize their experience further.

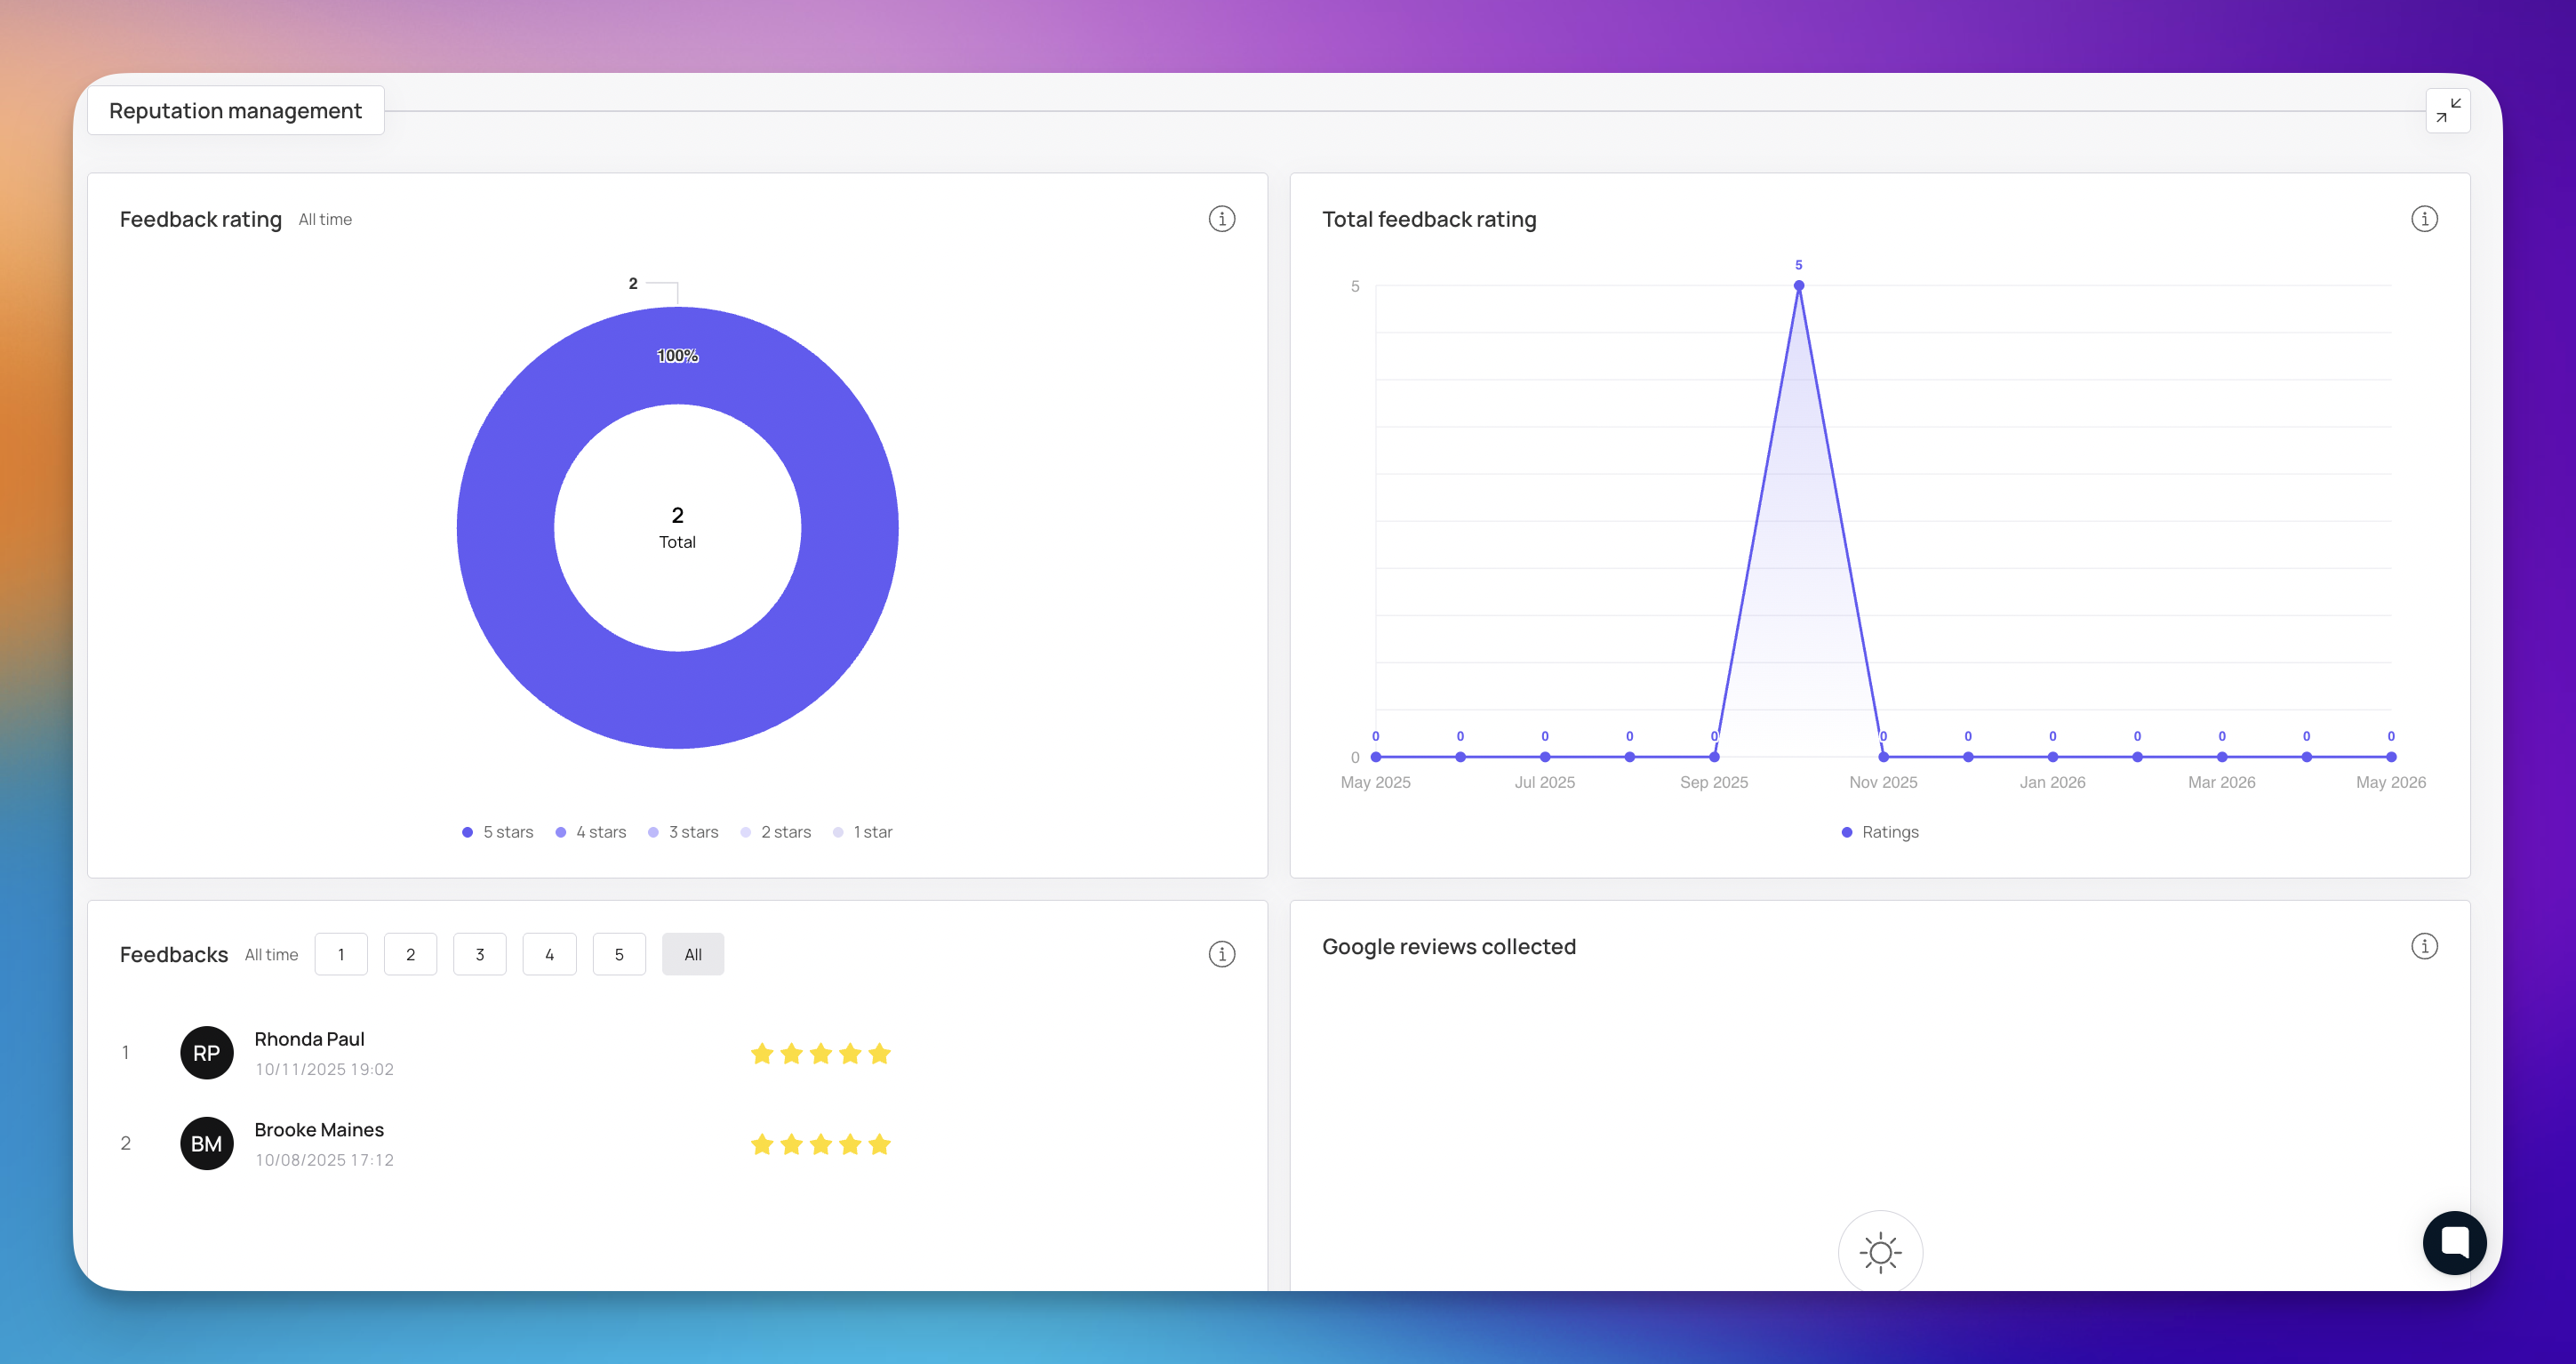
This section provides the qualitative data that numbers can’t capture.
Pain Point Discovery: Use the Feedbacks List to look for patterns in 3-star or 4-star reviews. These often contain "soft" complaints—such as the digital card being hard to find in a wallet or a specific reward being out of stock.
Validation of Success: Your 5-star reviews tell you exactly what is working. If members specifically mention how much they love the "Free Coffee after 5 stamps" reward, you know that is a core feature of your program that should be highlighted in your marketing.
While each chart provides a unique perspective, the real power of analytics lies in data intersection. When you combine the "Who" (Demographics) with the "How" (RFM Segments) and the "When" (Time Activity), you move from reactive management to proactive strategy.
By looking at these metrics together, you can identify if a drop in revenue is a timing issue, a demographic shift, or a breakdown in your reward "burn rate." This holistic view allows you to stop guessing and start engineering growth.
Here is how different businesses can bring these data points together to overhaul their loyalty strategy:
The Data Intersection: Stamps Analytics + Time Activity Heatmap.
The Insight: You notice that while Stamps Earned are high on Friday nights, they are non-existent on Tuesday mornings.
The Strategy: Improve your program by introducing "Double-Stamp Tuesdays." By using your Time Activity data to identify the dead zones and your Stamps data to provide the incentive, you balance your foot traffic throughout the week without devaluing your product.
The Data Intersection: Average Revenue per Segment + Feedbacks List.
The Insight: Your Inactive segment has a very high average spend, and the Feedbacks List shows that these high-spenders value "personalized service" and "exclusivity."
The Strategy: Move away from "10% off" coupons, which may not appeal to this group. Instead, create a Champions-only "Private Shopping" tier. Use the revenue data to justify the cost of the event and the feedback data to ensure the perks (like personal styling) match their expectations.
The Data Intersection: Age Demographics + Referral Conversion.
The Insight: Your core audience is in the 25–34 age bracket, and your Referral Conversion is 100%, but the total number of referrals is low.
The Strategy: This demographic is highly social but busy. Improve the program by making the referral link "one-tap" shareable on platforms they use. Offer a "Buddy Pass" reward—if they refer a friend, both get a free add-on service. The 100% conversion rate proves that once people are invited, they join; you just need to increase the invitation volume.
The Data Intersection: Churn Rate + Rewards Redeemed.
The Insight: You see a Churn Rate that spikes every 3 months, and a low Rewards Redeemed count.
The Strategy: This suggests customers are earning points but forgetting they exist, leading them to try a competitor. Improve your strategy by implementing a "Point Pulse" email—an automated reminder sent to anyone who hasn't visited in 45 days, showing them exactly how close they are to their next free service.
Effective loyalty programs thrive on consistent, data-driven iteration. By merging demographic insights with behavioral patterns, you unlock deeper personalization. Monitor the real-time activity feed to validate your strategic shifts.
Every chart offers a unique blueprint for increasing member retention. Start applying these metrics today to outpace your competition.
Multi-Business Reporting in Loyally
Choose between unified reporting or separate dashboards for multiple brands