The Loyalty Card Statistics dashboard provides a clear overview of your business activity regarding new clients and card issuance. This data helps you track growth and monitor operational efficiency directly from your admin panel.
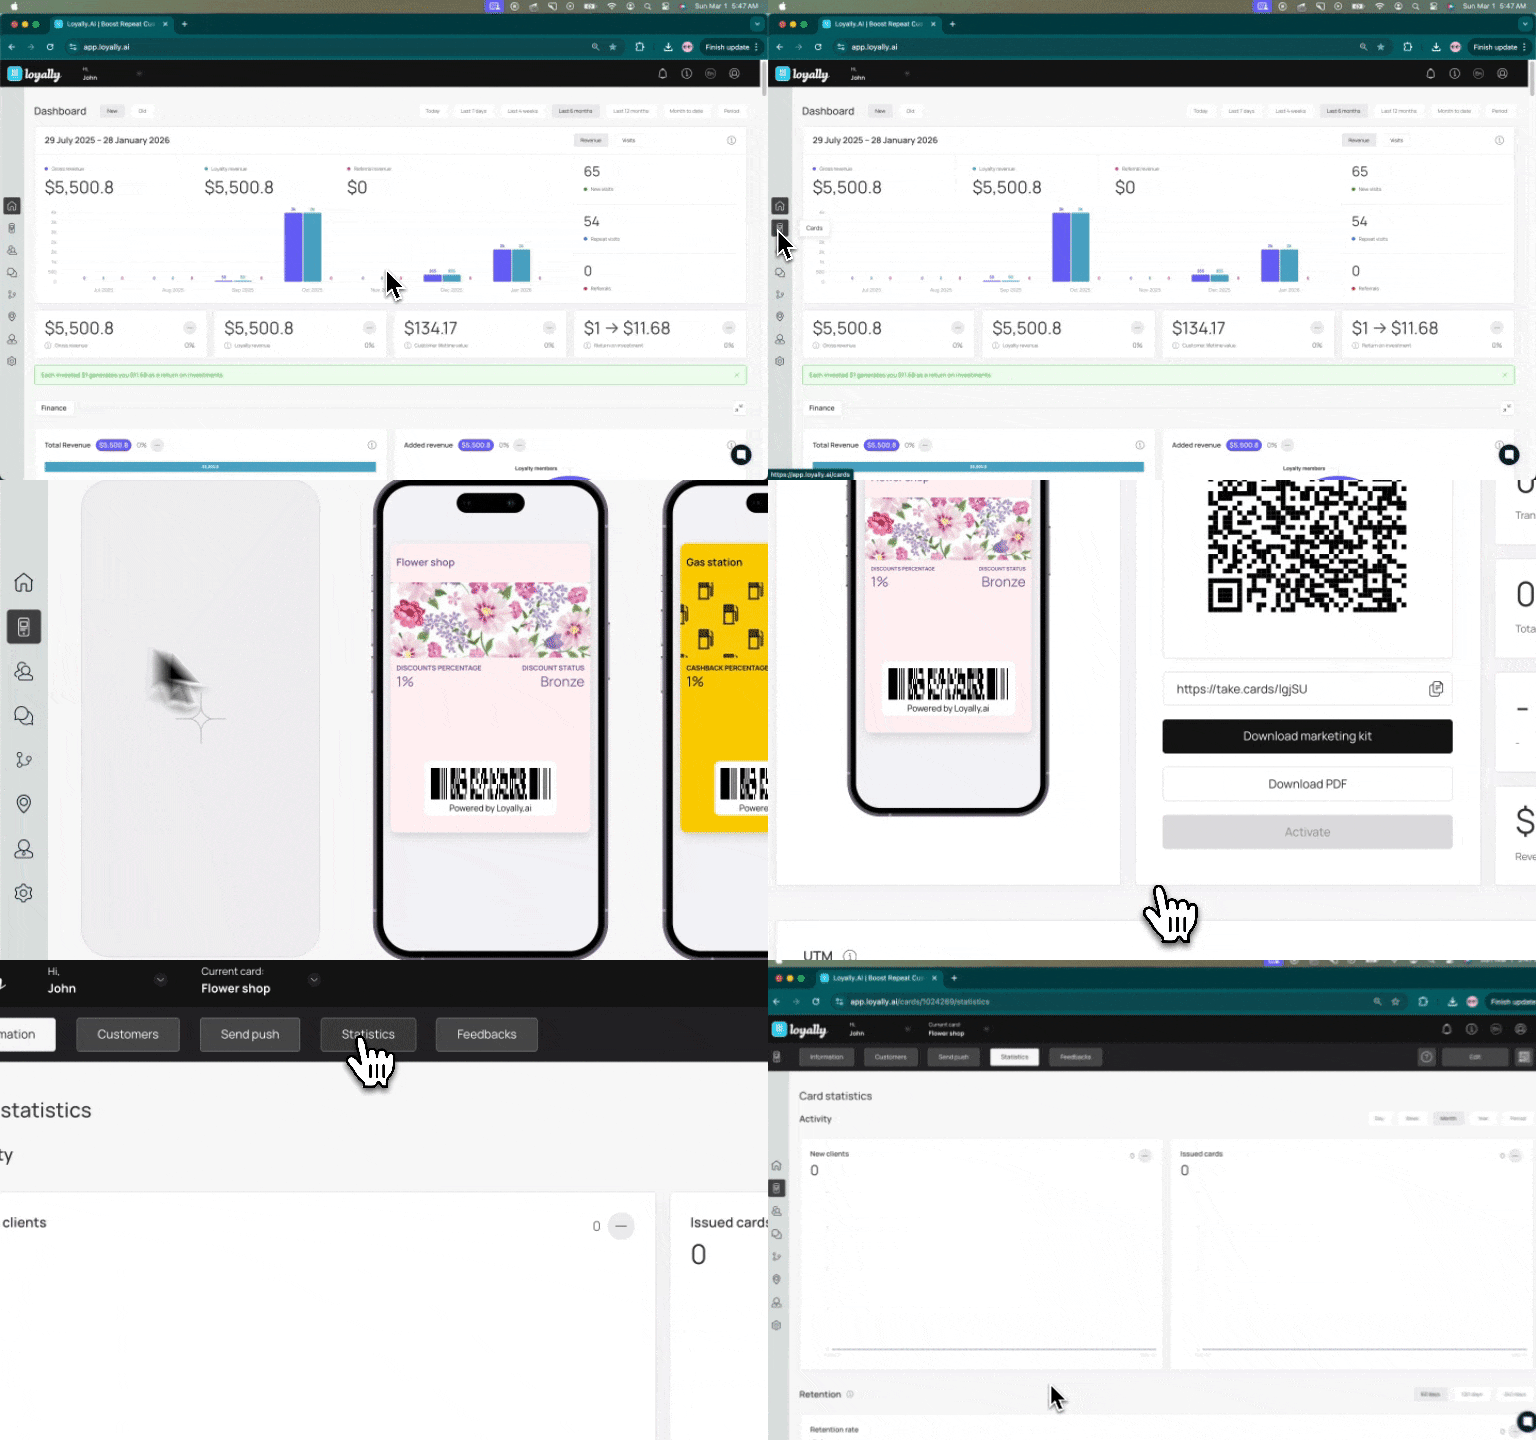
To access the statistics for your loyalty cards, follow these steps:
Log in to Loyally.ai.
Go to ’Cards’ from the main dashboard panel.
Select the active loyalty card you want to see the statistics of.
Click 'Statistics' after opening specific active loyalty card.
The Activity section highlights two key metrics over a specific time period.
New Clients: Displays the total number of new clients registered within the selected timeframe.
Issued Cards: Displays the total number of cards issued to clients within the selected timeframe.

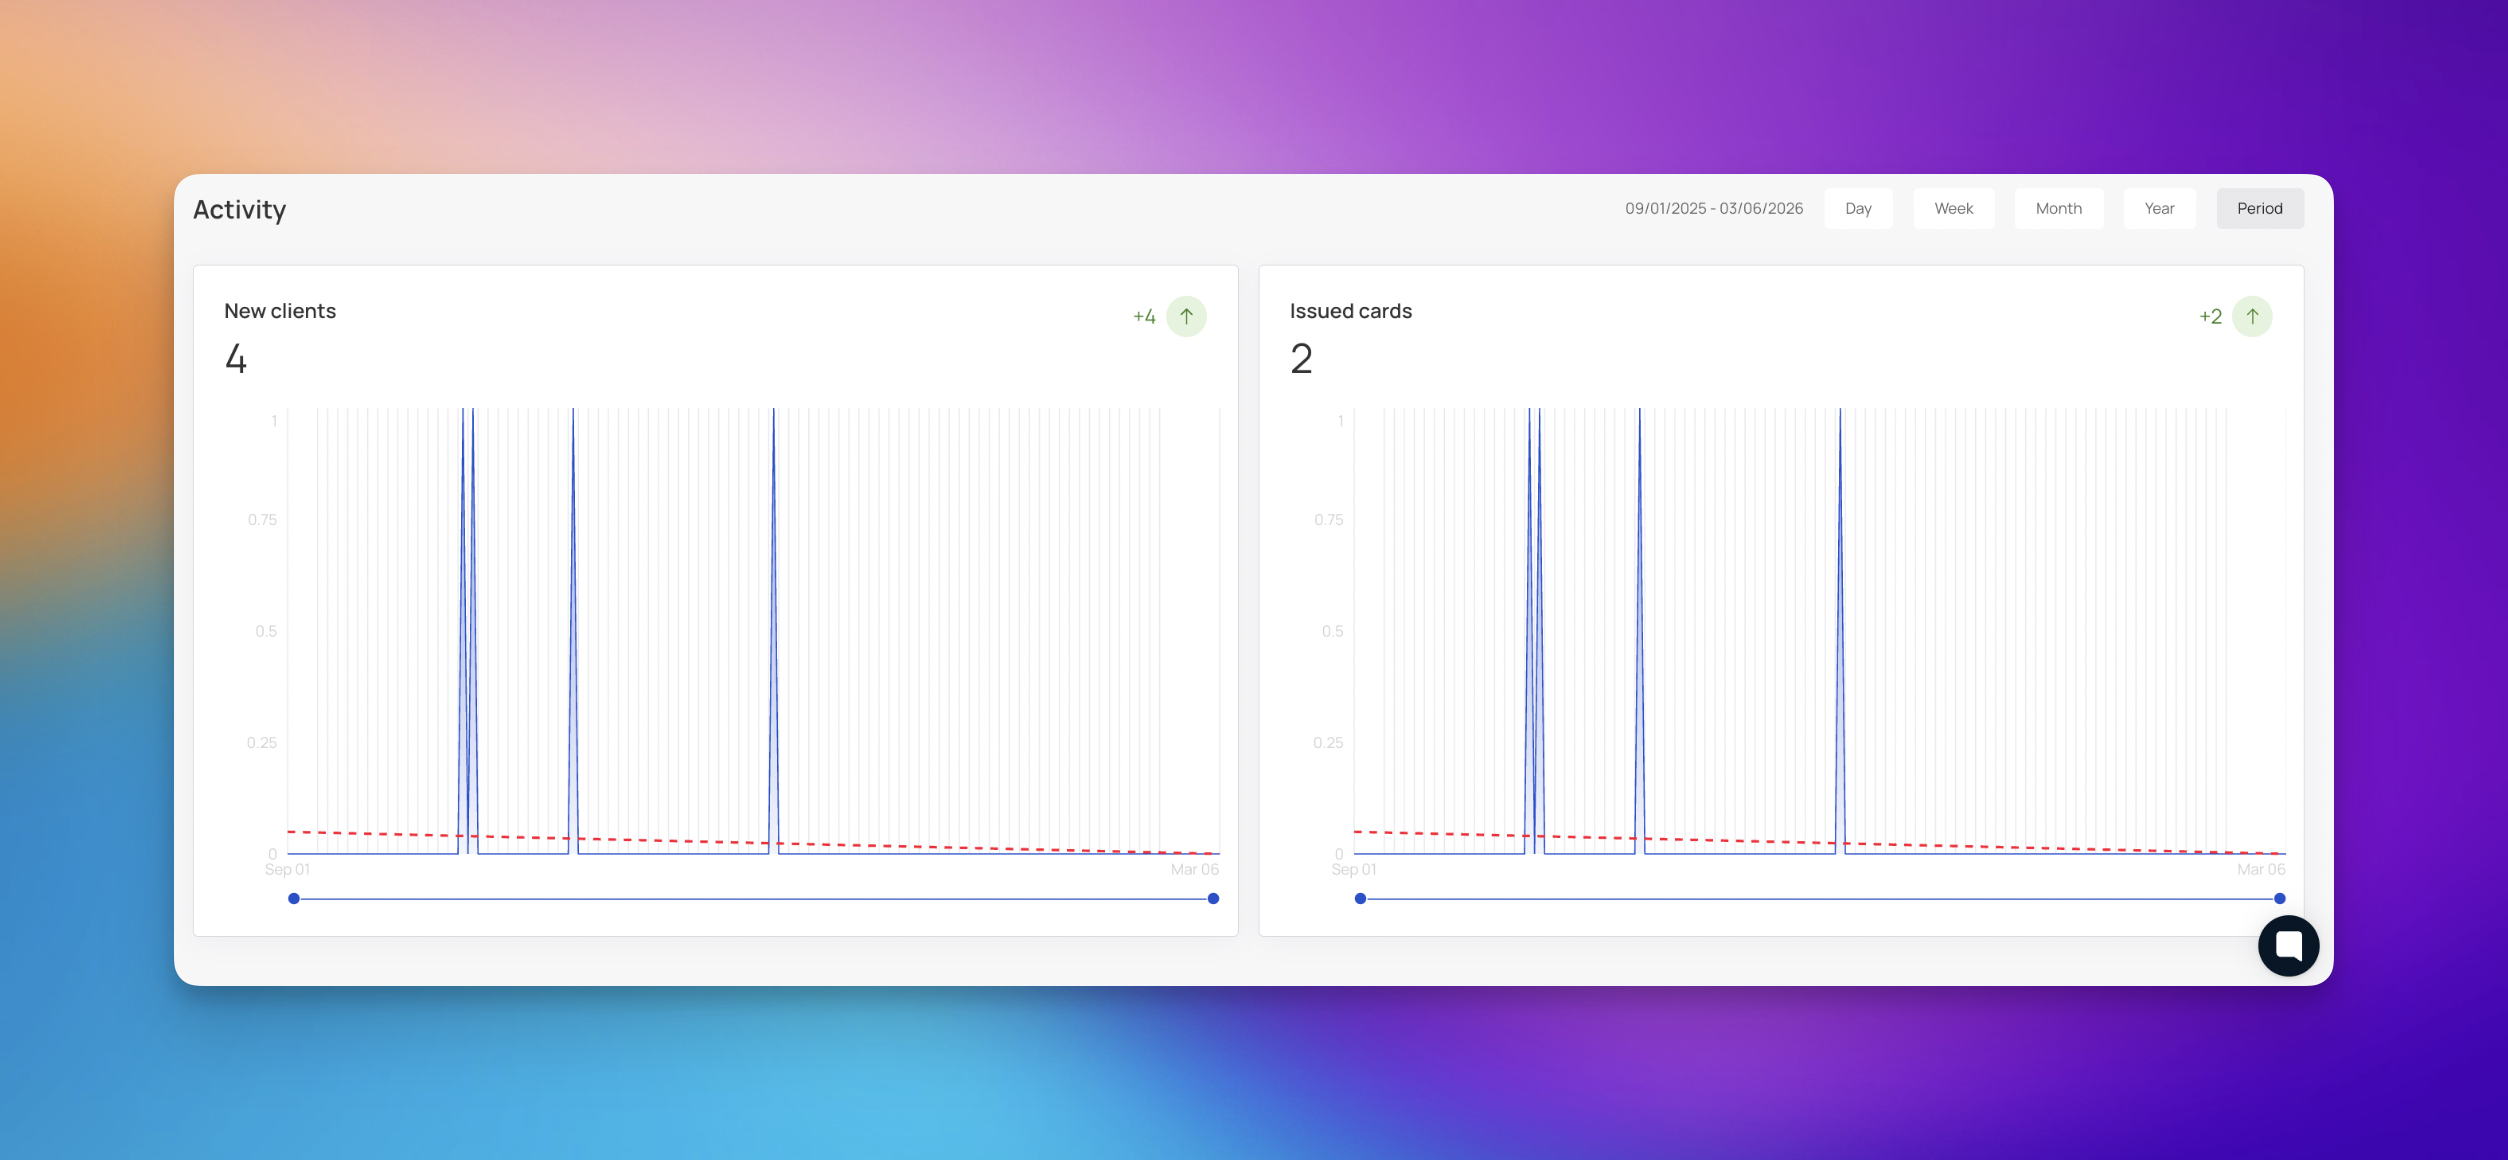
You can customize the view to analyze data trends over different periods. Use the navigation buttons in the top right corner to switch between:
Day
Week
Month (Default view)
Year
Period
Monitor Weekly Growth: Check your weekly activity to identify trends in new customer acquisition.
Identify Spikes: Look for spikes in issued cards to identify successful promotions.
The Retention section of your dashboard helps you measure how effectively your business keeps clients over time. The Retention rate metric shows the percentage of clients who continue to use your services or hold an active card within a specific timeframe.
Current Rate: The large percentage figure indicates your current retention rate.
Comparison: The graph allows you to compare the retention rate between the Current period (blue line) and the Previous period (orange line).
You can analyze retention data based on different time intervals by selecting from the options in the top right corner:
60 days
120 days
240 days
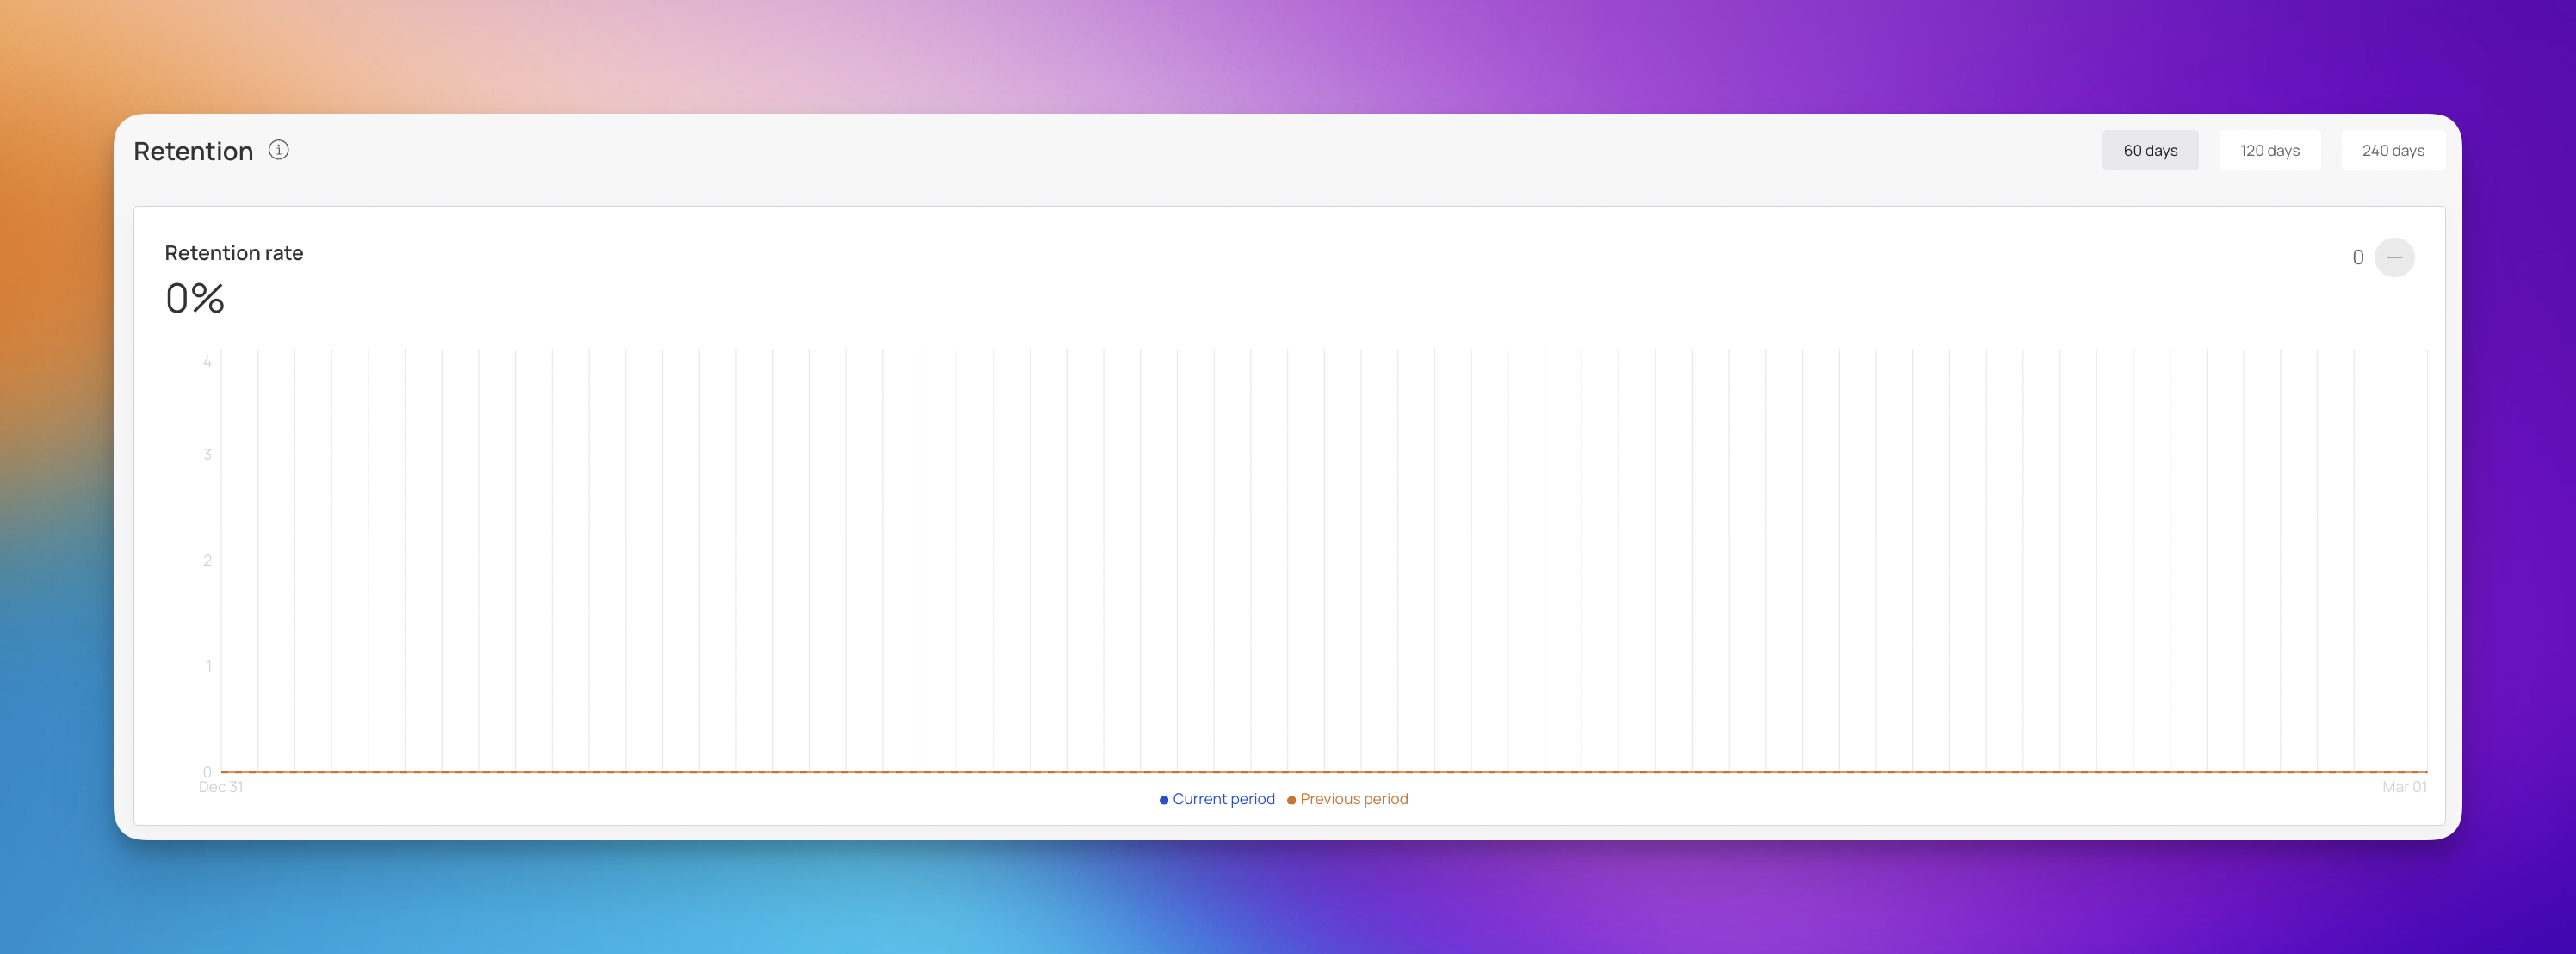
Analyze Trends: Use the graph to compare your current retention rate against previous periods to ensure customer loyalty is improving.
Adjust Marketing: If retention drops, consider implementing re-engagement campaigns for inactive members.
The Feedback rating section allows you to gauge customer satisfaction and monitor the loyalty levels of your clients. This data helps you understand how well your loyalty program is performing and identify areas for improvement.
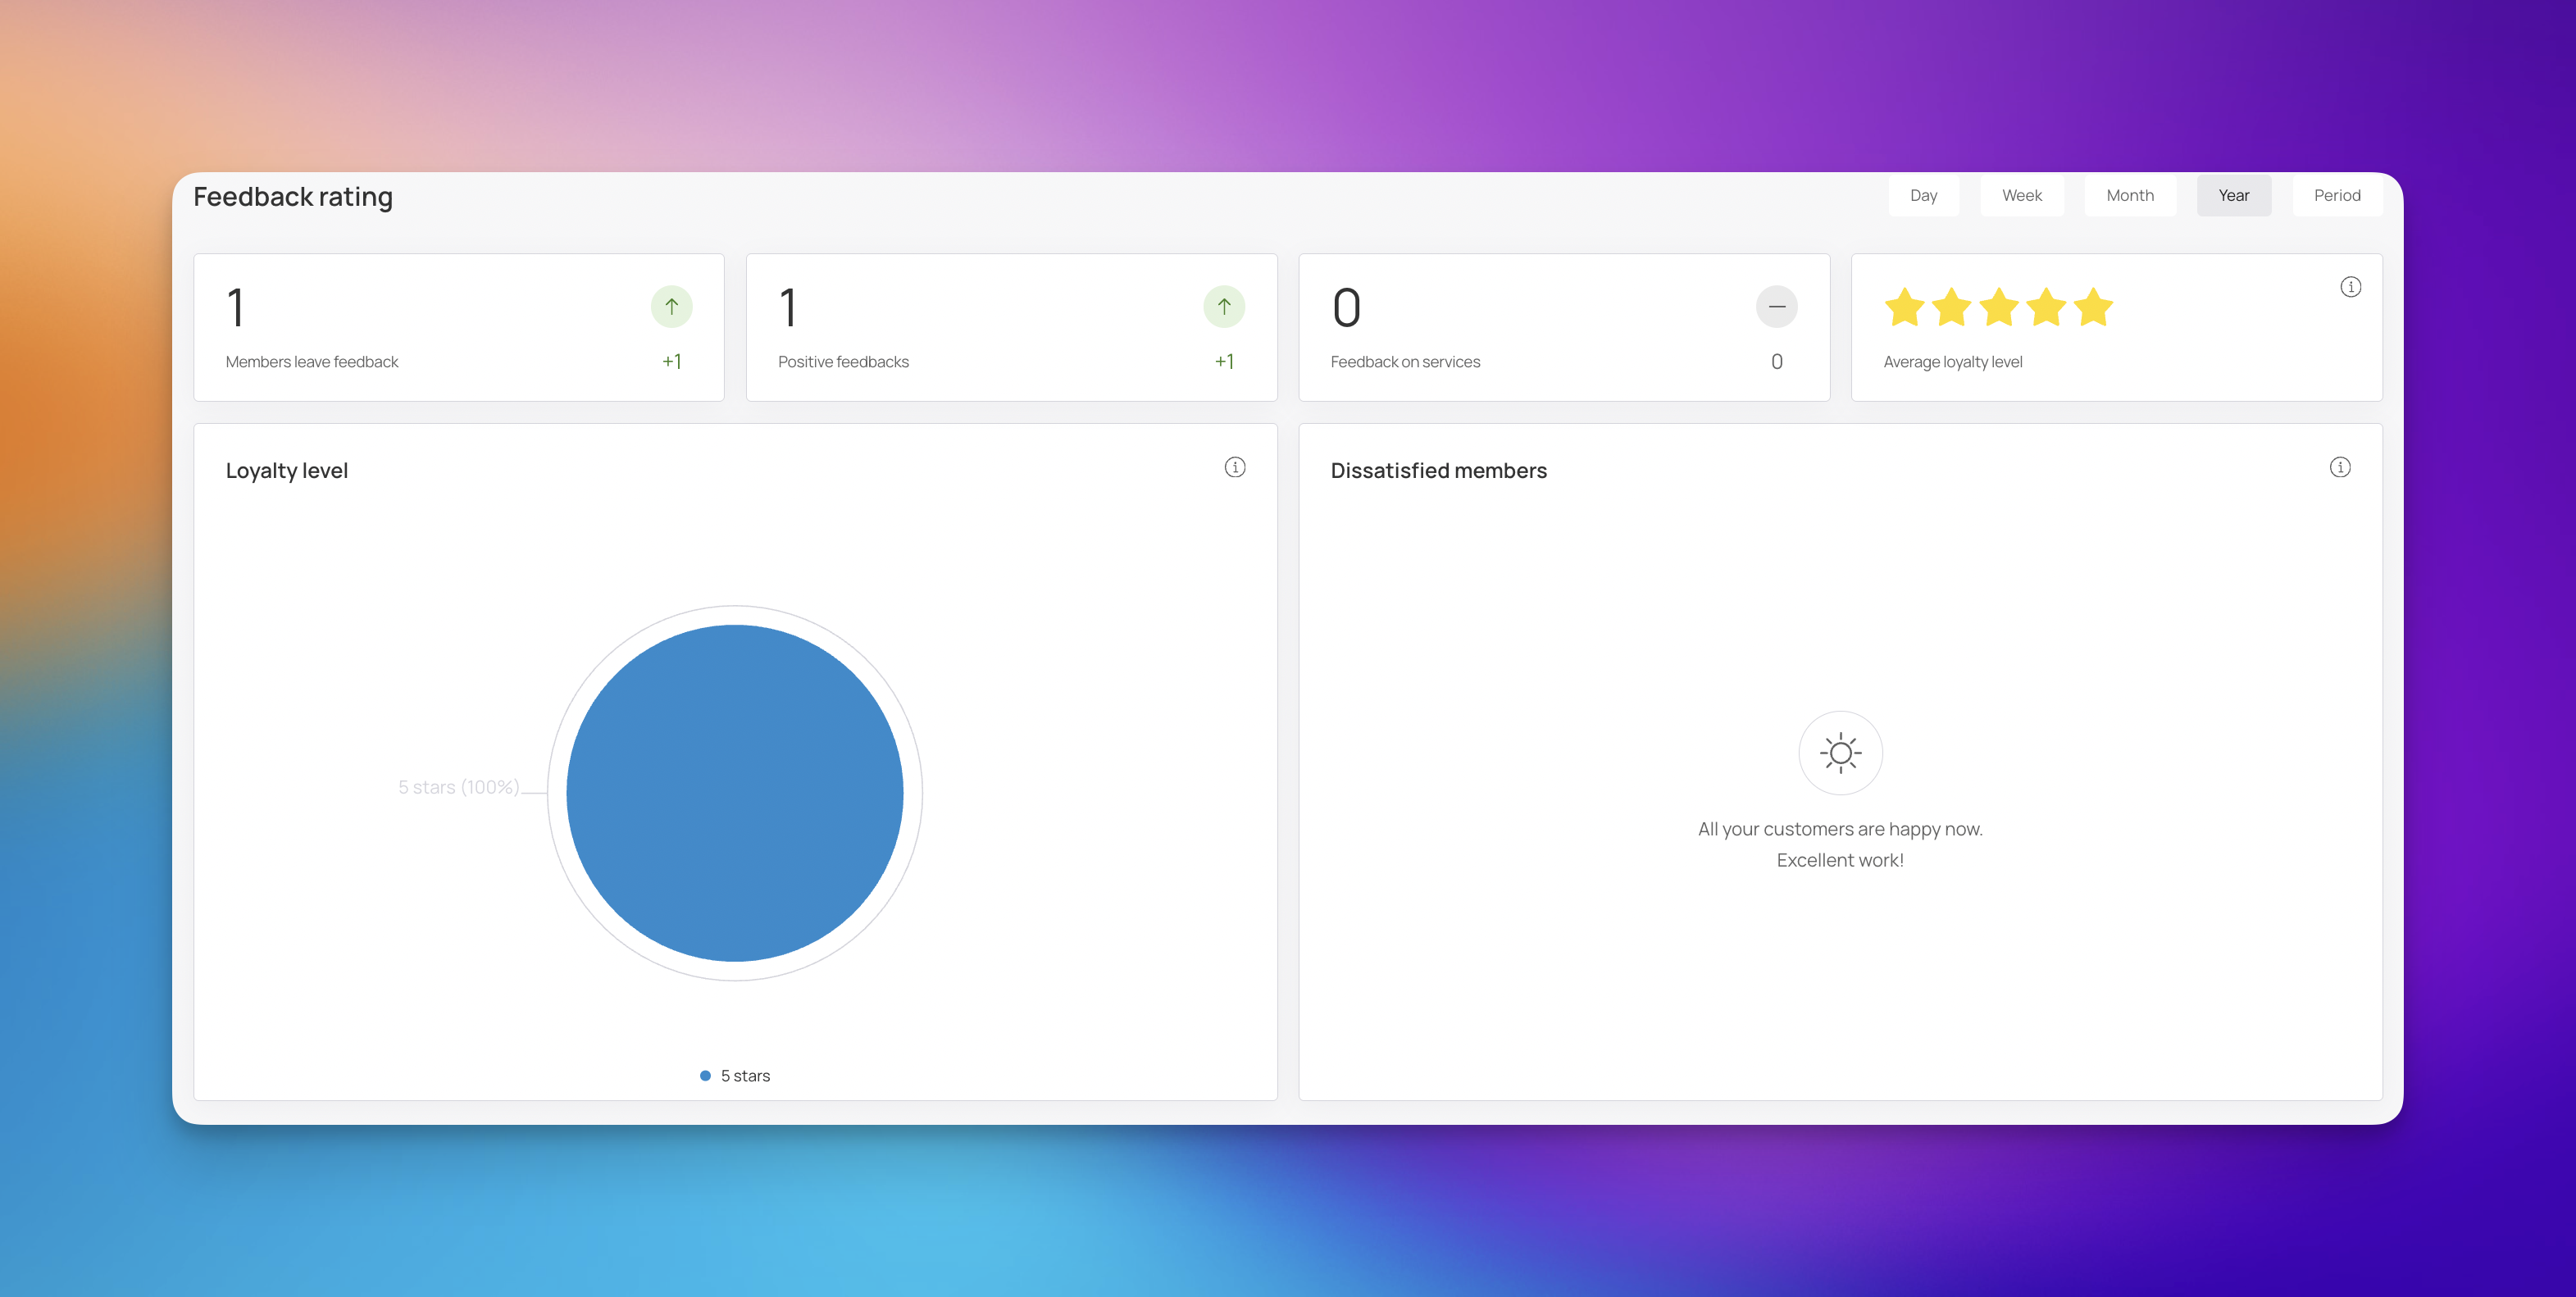
This section displays key metrics related to customer feedback on services or the loyalty program.
Members leave feedback: Displays the total number of feedback submissions.
Positive feedbacks: Shows the number of positive feedback submissions received.
Feedback on services: Indicates the number of specific feedback instances regarding services provided.
Average loyalty level: Visualized with stars, this metric indicates the overall satisfaction or loyalty level of your customers.
Loyalty level: Displays detailed trends or breakdowns of customer loyalty levels. If data is unavailable, it will indicate that there is not enough data yet.
Dissatisfied members: Highlights specific feedback or metrics related to dissatisfied customers. If all customers are satisfied, it will confirm that all customers are happy.
You can analyze feedback data based on different time intervals by selecting from the options in the top right corner:
Day
Week
Month (Default view)
Year
Period: Allows you to define a custom range of data you want to view.
Address Dissatisfaction: Promptly review feedback from dissatisfied members to resolve issues and improve service.
Reward Loyalty: Identify members with the highest loyalty levels and consider offering them exclusive rewards.
The Referral program section allows you to track how effectively your existing members are sharing your loyalty cards and attracting new clients.
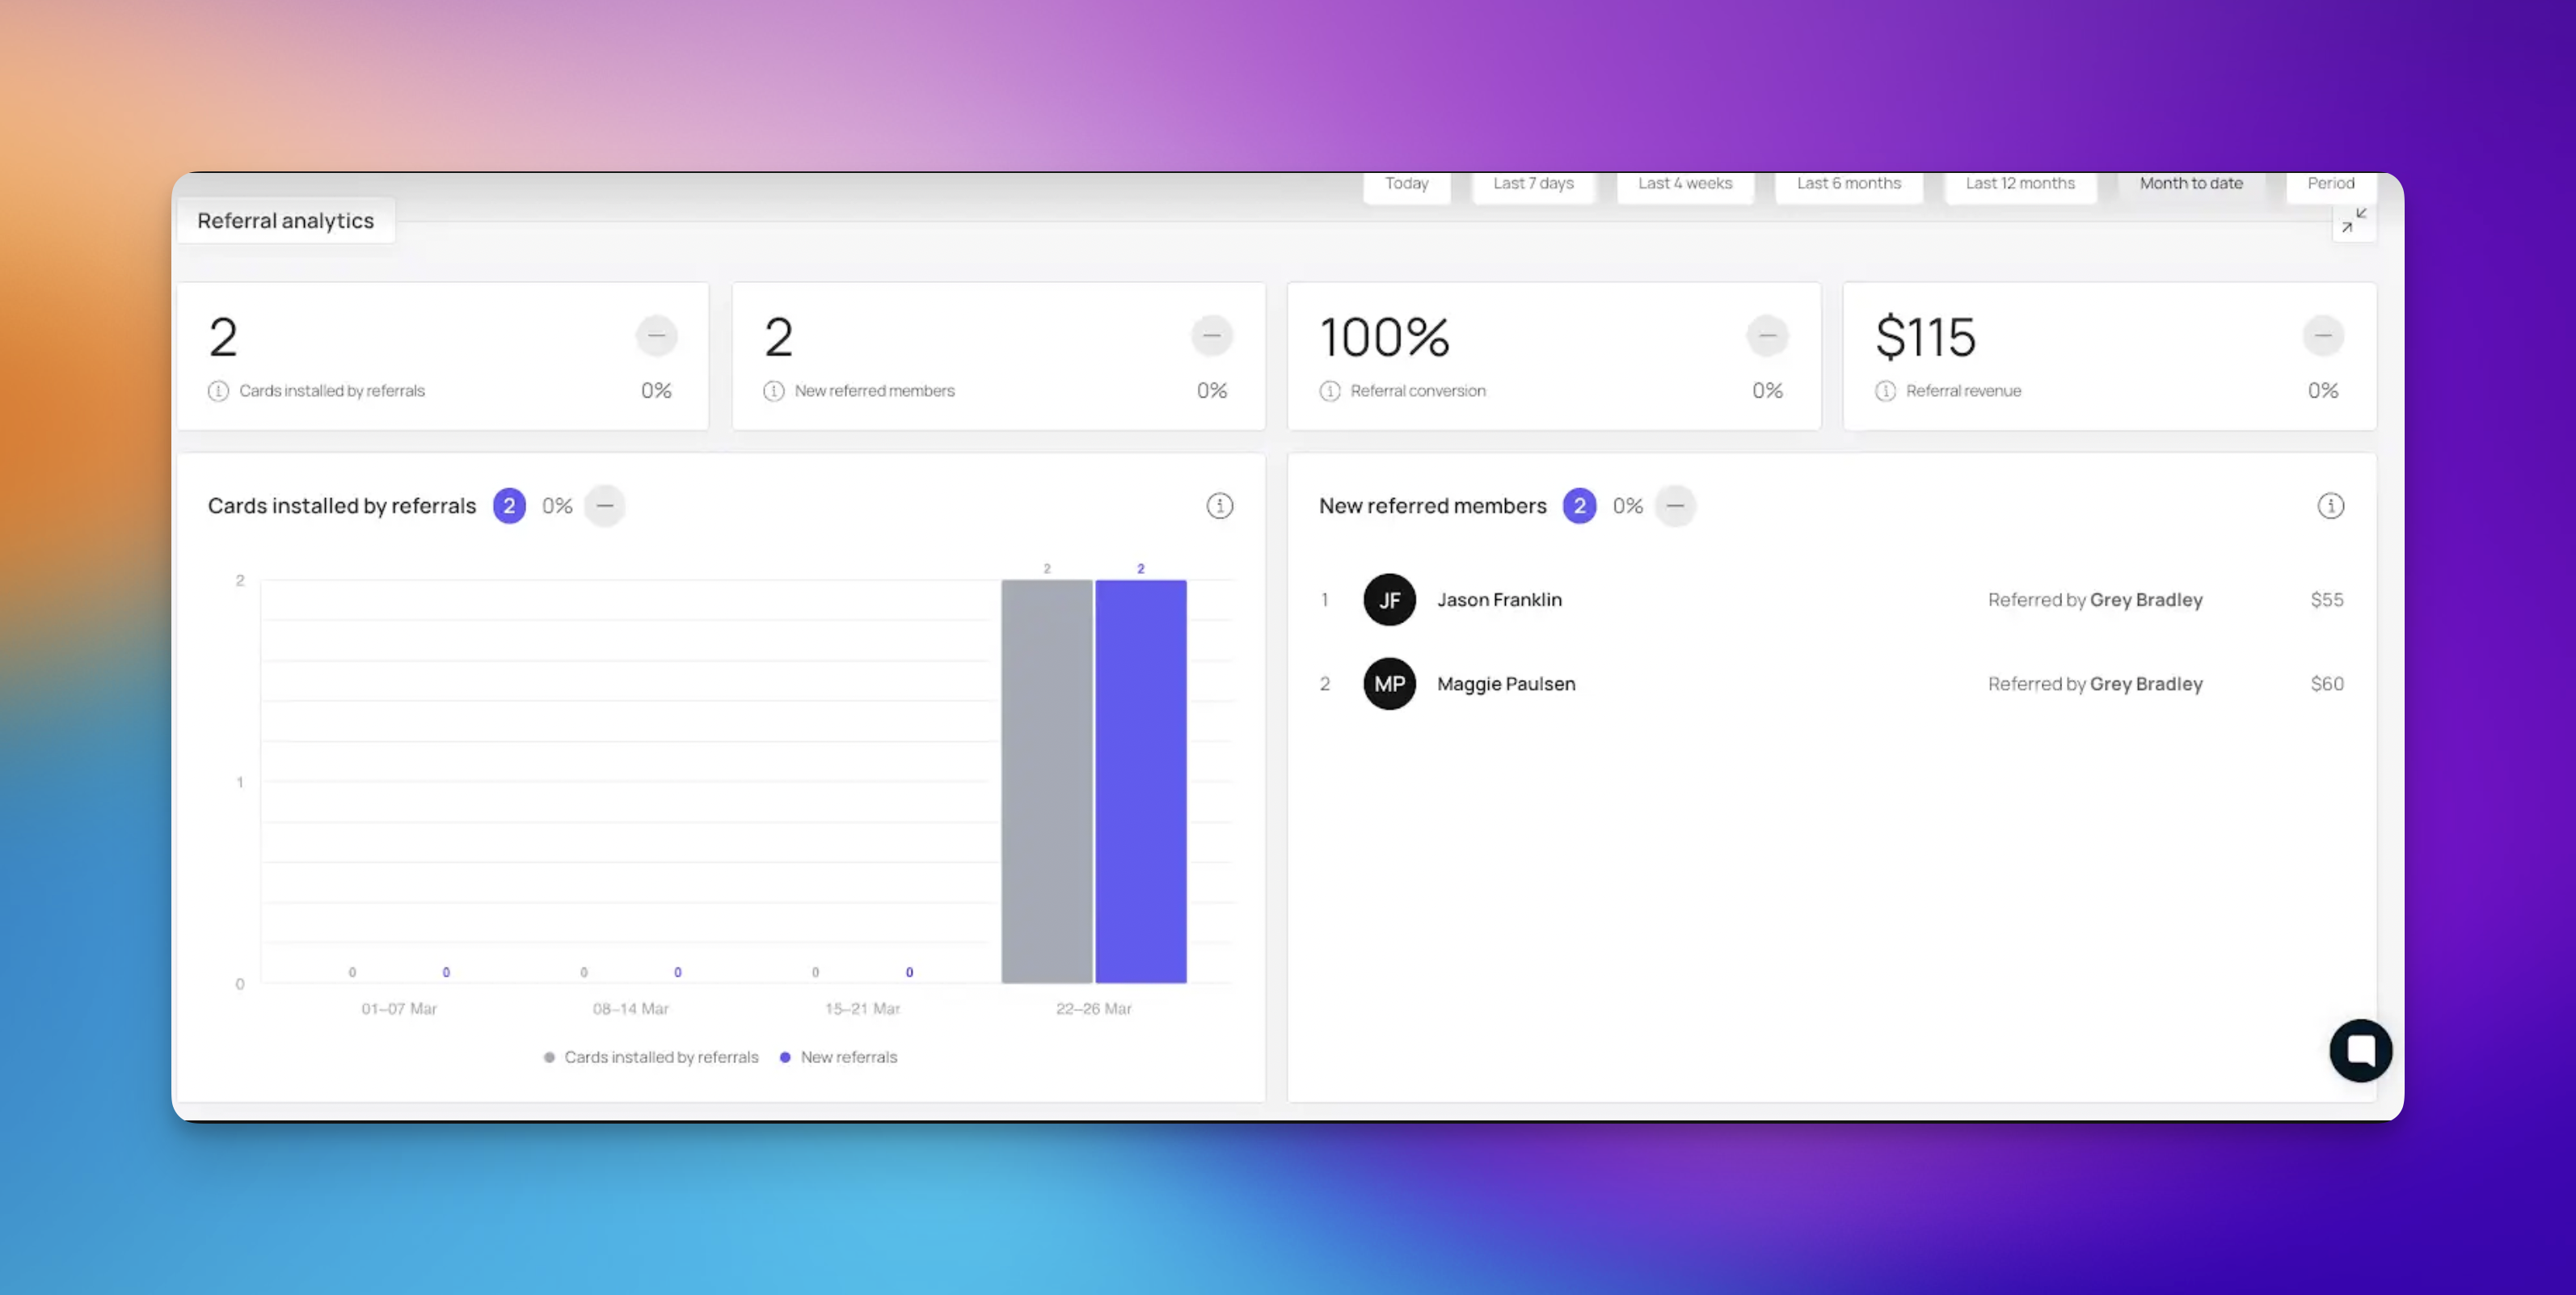
This section provides key performance indicators to monitor the success of your referral efforts.
Shared cards: The total number of times loyalty cards have been shared by members.
Cards installed by referrals: The number of new cards installed as a direct result of referrals.
New referral members: The total count of new members who joined via referrals.
Revenue from referrals: The total revenue generated from clients brought in through the referral program.
Referral program dynamic: A line graph that shows the activity level of the referral program over time.
Top-10: A ranking of members who have generated the most activity, which can be sorted by total visits.
You can analyze referral data based on different time intervals by selecting from the options in the top right corner:
Day
Week
Month (Default view)
Year
Period: Allows you to define a custom range of data you want to view.
Incentivize Sharing: Use the "Shared cards" metric to measure the success of referral incentives.
Reward Top Referrers: Identify and thank your "Top-10" referrers to encourage continued sharing.
The Customer Profile section provides a demographic and behavioral breakdown of your clientele, helping you understand who your loyalty program users are.
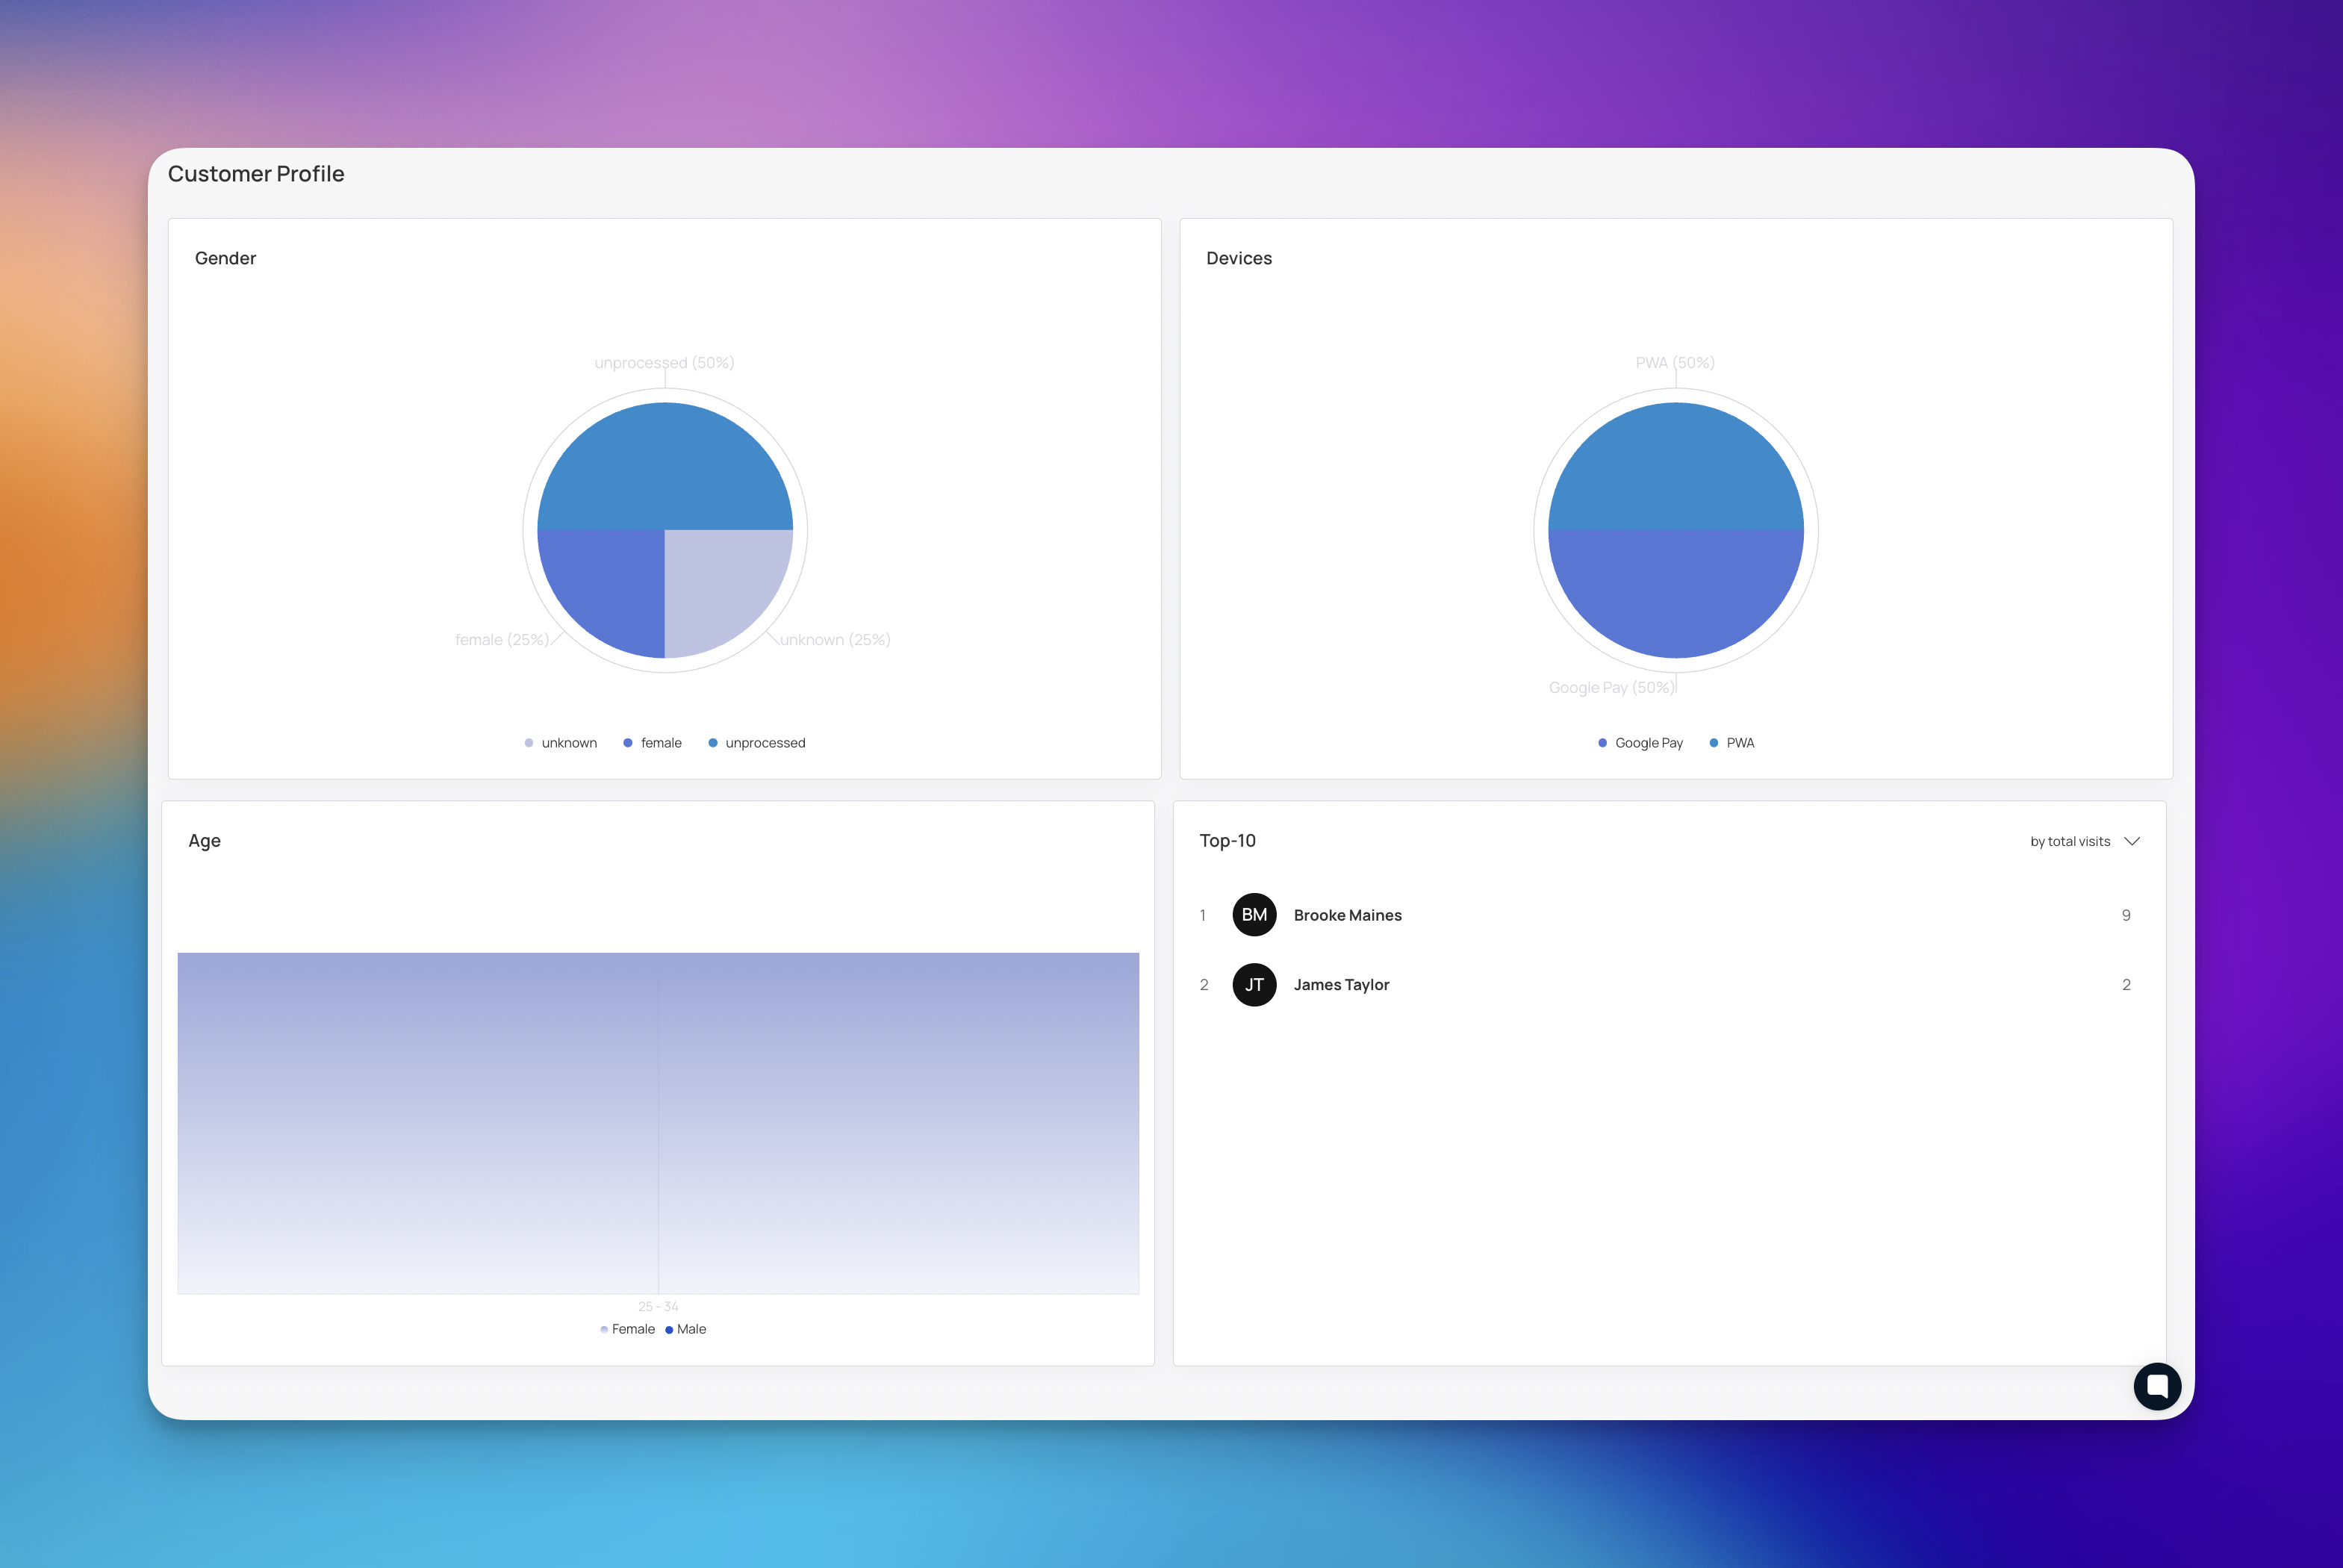
This section helps you visualize the composition of your customer base.
Gender: Displays a pie chart breaking down your customers by gender (e.g., male, unknown).
Devices: Shows the types of devices your customers are using to access their loyalty cards. If data is not yet available, this section will reflect that.
Age: Shows the age distribution of your members. Note that if data is unavailable, it will indicate that there is not enough data yet.
Top-10: Lists your top customers ranked by total visits, highlighting your most loyal members.
Targeted Marketing: Use demographic data (gender, age) to create marketing campaigns tailored to your main customer base.
Optimize for Devices: Understand which devices your customers use to ensure your loyalty cards display correctly.
By analyzing Retention data alongside Feedback Ratings, you can determine if your loyalty program is successfully keeping customers happy and engaged.
If retention is high but feedback is low, you might look at Referral Metrics to see if members are sharing the card anyway, indicating a functional rather than emotional loyalty.
Understanding Customer Profile demographics allows you to tailor rewards to better fit the preferences of your highest-visiting members, ultimately maximizing return on investment.
Promotions
Step-by-step guide to setting up time-limited offers, events, and campaigns that appear directly on your customers’ digital loyalty cards.
How to Distribute Cards Based on Manually Created Customer Segments?
Sending Targeted Rewards to Your Manually Created Customer Segments